LAN Traffic Analysis for rpi001.
| Description: | Native snmp. |
| Info: | In bytes/sec. |
The statistics were last updated Wednesday, 23 September 2026 at 18:31,
at which time 'RPI001' had been up for 24 days, 0:33:50.
`Daily' Graph (5 Minute Average\)

|
Max |
Average |
Current |
| In |
241.0 B/s (0.0%) |
143.0 B/s (0.0%) |
139.0 B/s (0.0%) |
| Out |
32.0 B/s (0.0%) |
27.0 B/s (0.0%) |
26.0 B/s (0.0%) |
`Weekly' Graph (30 Minute Average\)
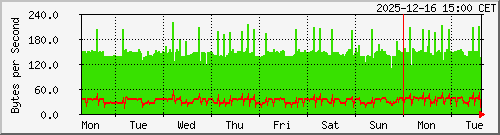
|
Max |
Average |
Current |
| In |
189.0 B/s (0.0%) |
140.0 B/s (0.0%) |
139.0 B/s (0.0%) |
| Out |
29.0 B/s (0.0%) |
26.0 B/s (0.0%) |
27.0 B/s (0.0%) |
`Monthly' Graph (2 Hour Average\)
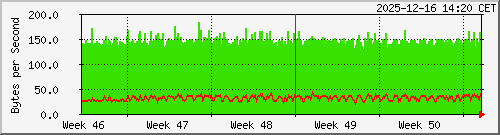
|
Max |
Average |
Current |
| In |
157.0 B/s (0.0%) |
140.0 B/s (0.0%) |
141.0 B/s (0.0%) |
| Out |
28.0 B/s (0.0%) |
25.0 B/s (0.0%) |
26.0 B/s (0.0%) |
`Yearly' Graph (1 Day Average\)
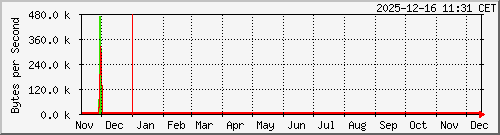
|
Max |
Average |
Current |
| In |
184.0 B/s (0.0%) |
140.0 B/s (0.0%) |
141.0 B/s (0.0%) |
| Out |
36.0 B/s (0.0%) |
28.0 B/s (0.0%) |
27.0 B/s (0.0%) |
| GREEN ### |
Incoming Traffic in Bytes per Second |
| RED ### |
Outgoing Traffic in Bytes per Second |


